

Having tried XY plotting signals with both oscilloscopes1 and sound cards,2 I wondered about a bare-bones approach using the ADCs in a microcontroller. To make things easy, I reached for an Arduino.3 In particular, an Arduino Uno4 which is essentially a ATmega3285 microcontroller plus a link to a host computer. We can use this link to display the results on a computer rather than going to the hassle of driving a screen from the Arduino itself.
On the face of it, using an Arduino seems doomed. Although it has 8 analogue inputs, these channels are multiplexed onto a single ADC. Furthermore, the ADC is slow: the standard Arduino software only manages about 10k samples per second: about a quarter the frequency of the ADC in a sound card.
However, this is a bad way to think about the problem. In a normal sampled data system, like the sound interface, the sampling rate is critical. The Nyquist Theorem6 tells us that if we sample at a frequency \(2 f\) we can’t distinguish signals with frequencies \(f \pm \Delta\). So, in a sound card the input signal is usually low-pass filtered to remove frequencies above \(f\). However, this is not the case with the Arduino.
For now, pretend that the Arduino can capture two channels simultaneously, and that we set it up to make a pair of readings roughly every second. Would this be able to generate a XY plot of a stationary signal ?
Happily it could, modulo a couple of important caveats:
- To get reasonable results, experiment suggests we need a few thousand coordinates, so we’d need to wait a long time: perhaps half-an-hour for a simple figure and many hours for something more complicated. In other words we care about the sampling rate not because it governs what we can see, but how long it takes to collect the data.
- Each reading needs to be accurate. Suppose we fed the ADC a very fast signal: this would be doomed to failure, not because we took samples infrequently, but because none of the samples would be representative of the signal at that point in time. The front-end of the ADC has a sample-and-hold circuit which is basically a switch and a capacitor: when a particular channel is chosen it is connected to the capacitor by the switch and current flows until the voltage across the capacitor matches the input voltage. We need to ensure that the switch is only closed briefly, and that enough current can flow into the capacitor which it does. The ATmega data sheet isn’t explicit about the values, beyond noting that it’s not likely to be a problem. For now, let’s not argue with their optimism.
The one concern is the issue of simultaneous samples which we explicitly ignored above. On real Arduinos the sampling rate does matter because it sets an lower bound on the time between samples on the \(x\) and \(y\) channels.
As we mentioned above, the standard Arduino software manages about 9,600 conversions per second on the Uno, which means that each one takes about 100µs, and thus the \(x\) and \(y\) channels will be skewed by at least this amount. Will this matter ?
Let’s consider a specific example: will it be able to plot the 70Hz frame rate text we displayed with scopes and sound cards ? Setting the frame rate to 70Hz was close to the ideal speed for the sound card, so we know that the important information in the signals was contained in frequencies up to about 20kHz.
In rough terms, if the 20kHz components are important, we expect that the signal changes in important ways on a time scale of about 50µs. Further, it suggests that points on the signal 100µs apart will often be unconnected. This does not sound promising!
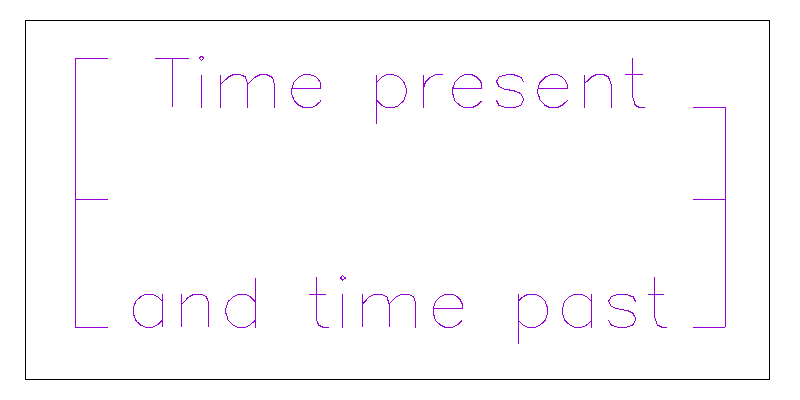
Let’s simulate the effect. The plots below show the effects of delaying the \(y\) channel by multiples of about 17µs. Although our analysis above was crude, we see that things do indeed begin to degrade significantly at about 50µs.
Original signal
17µs delay
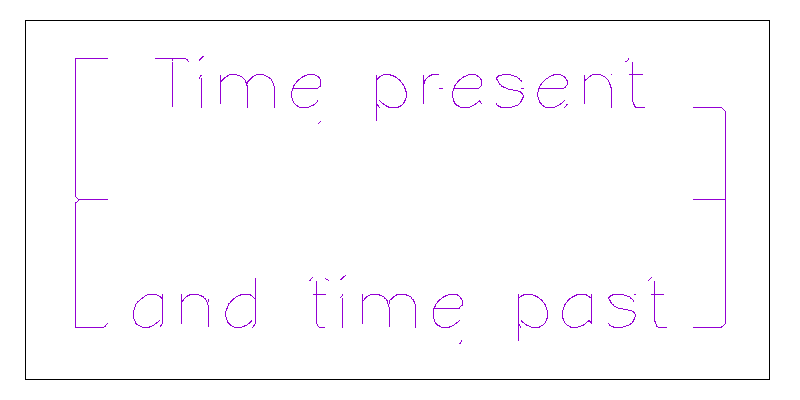
35µs delay

52µs delay
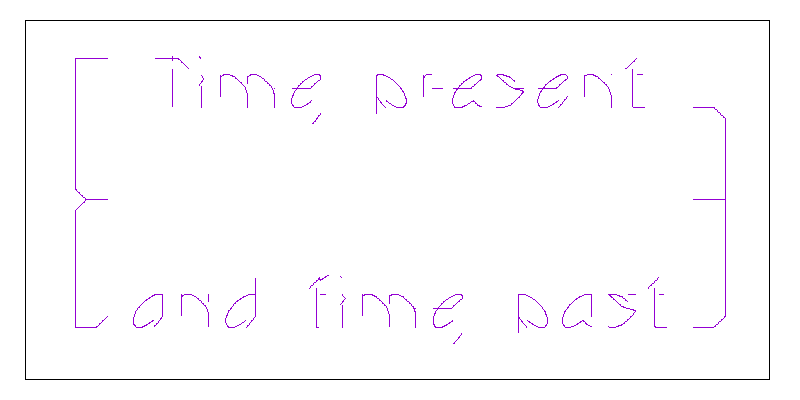
70µs delay

105µs delay
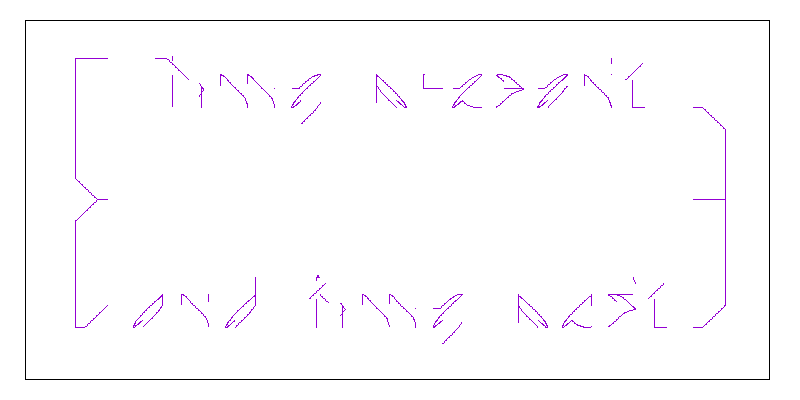
Real data
So much for theory, lets look at the actual data:
As we expected, it looks pretty grotty, but the similarity to the 100µs prediction is pleasing. Not only is it nice to see theory and experiment agree, it gives us some hope that if we could speed up the Arduino’s ADC, we might be successful.
Speeding it up a notch
Other people have bemoaned the Arduino’s slow ADCs, and noted that you can speed them up without many side-effects. Of particular note is a fine article by Guy van den Berg7 in which he describes how to reduce the ADC sample time to about 20µs with only minor loss in accuracy.
Happily this change is easy to implement, and works perfectly!
Practical details
Having shown the results, let’s look at the recipe. The hardware is simple: an Arduino Uno.8 Connect the \(x\) and \(y\) signals to the A0 and A1 analogue inputs. Most of the time you will need some signal processing too. The Arduino wants 0–5V, and I was generating 0–3.3V so I didn’t bother.
On top of this, we will need:
- Firmware for the Arduino, to digitize the signals, and send them to an attached PC.
- Software for the PC to display the data. In keeping with the Arduino style, this is written in Processing,9 and runs on Linux, OS X and Windows.
Arduino Firmware
The code is almost trivial:
// Crank up ADC speed as per
// http://www.microsmart.co.za/technical/2014/03/01/advanced-arduino-adc/

const unsigned char PS_16  = (1 << ADPS2);
const unsigned char PS_32  = (1 << ADPS2) | (1 << ADPS0);
const unsigned char PS_64  = (1 << ADPS2) | (1 << ADPS1);
const unsigned char PS_128 = (1 << ADPS2) | (1 << ADPS1) | (1 << ADPS0);

void setup()
{
   // Set serial port to the maximum commonly used speed
   Serial.begin(115200);

   // ADC prescaler to 16 => 1MHz clock with 16MHz part => ~20us per sample
   ADCSRA &= ~PS_128;
   ADCSRA |=  PS_16 ;
}

void loop()
{
   int x = analogRead(A0);
   int y = analogRead(A1);

   Serial.print(x);
   Serial.print(" ");
   Serial.println(y);

   delayMicroseconds(250 + random(250));
}
As you can see the key idea is to sample channels A0 and A1, then send them over the serial port in ASCII decimal. It would be more efficient to send the data in binary, but using text is easy to debug and trace. It also makes it easy to plot the data with other software: for example you could just capture the data then plot them with Gnuplot.
The only subtle point is the delay: we will discuss this below.
Display software
Happily this is pretty simple too:
import processing.serial.*;

color  fg = color(0,255,0);
color  bg = color(0,0,0);

String portName = "/dev/cu.usbmodem14621";

Serial myPort;

void setup()
{
  size(1024, 1024);
  background(bg);
  noSmooth();

  myPort = new Serial(this, portName, 115200);
}

void draw()
{
  while(myPort.available() > 0)
  {
    int lf = 10;
    String s = myPort.readStringUntil(lf);

    if (s != null)
    {
      String[] ss = split(trim(s), " ");
      if (ss.length == 2)
      {
         int x =          int(ss[0]) + int(randomGaussian());
         int y = height - int(ss[1]) + int(randomGaussian());
         set(x,y,fg);
      }
    }
  }
}
Rather irritatingly, you will need to modify the definition of portName to reflect your Arduino. Once that’s done, you need only to start the program and watch the XY-plot appear. Typically this takes a few seconds.
You will notice that the coordinates are plotted with a bit of extra noise: this serves to enlarge points which occur frequently, making them more prominent.
The wisdom of pausing
Perhaps the only subtlety in the whole project is the need to include a random delay in the Arduino firmware. When we analyzed the system, we assumed that the sampling points would be randomly distributed in time. If we include a long random delay between the samples it is clear that the assumption is justified.
However, without it, the samples tend to occur in clumps when there is space in the serial port’s buffer. Between those gaps, no data are sampled, which leads to gaps in the XY-plot. Eventually, these gaps will fill, but it can take a surprisingly long time. Conversely with the delay the dots are plotted randomly, and the text appears slowly as though coming through the fog.
The form of the delay isn’t critical: the precise form shown distributes the samples well and doesn’t reduce the net sample rate very much.
Alternatives
Although this article focusses on the Arduino Uno and the ATmega328, the basic principles are more generally applicable. Many newer microcontrollers have better ADCs though, which makes things easier.
For example, had we used a Teensy 3.110 instead of the Arduino, we would enjoy an ARM Cortex-M4 chip which boasts two independent ADCs which would allow simultaneous reading. Much easier, but where’s the fun ?
References
- 1. ./xy-scope.html
- 2. ./xy-sound.html
- 3. https://www.arduino.cc
- 4. https://www.arduino.cc/en/Main/ArduinoBoardUno
- 5. https://en.wikipedia.org/wiki/ATmega328
- 6. https://en.wikipedia.org/wiki/Nyquist–Shannon_sampling_theorem
- 7. http://www.microsmart.co.za/technical/2014/03/01/advanced-arduino-adc/
- 8. https://www.arduino.cc/en/Main/ArduinoBoardUno
- 9. https://processing.org
- 10. http://www.pjrc.com/teensy/teensy31.html
![[ Atom Feed ]](../../atom.png "Atom Feed")