

Although the natural way to plot two signals against each other is with a dual-channel oscilloscope, regrettably not everyone has such an animal. However, many people do have a dual channel analogue input device for their computer in the form of a sound interface. So it’s natural to ask if we could use that instead.
It is worth saying that this is not a new idea: just ask Google,1 or follow this Instructable.2
Even if this works, it is important to realize:
- to get two input channels, we will need a stereo input;
- most sound cards will inly digitize signals in the 20Hz-20kHz audio band;
- for most applications you’ll need some sort of input protection or processing.
Computers are expensive, and so I was wary of using the internal sound hardware. Instead, I tried some cheap USB sound interfaces: happily these worked tolerably well.
Although using an external sound interface connected by USB reduces the risk of destroying the computer, it doesn’t completely protect it. Proceed at your own risk!
Cheap USB sound interfaces
I tried a three different sound cards, and perhaps unsurprisingly found that cost mattered. I made some more extensive notes3 elsewhere.
El-cheapo dongle

At about £1 this was the cheapest device. It was also a complete waste of money, because it has only one input channel. It’s probably fine for other jobs though.
C-Media CM6206 cards

Lots of people seem to be making interfaces based around the C-Media CM62064 (and cousins). They are cheap (about £7), and full-featured: 5.1 analogue outputs, stereo inputs, and optical input and output. Sadly though, the frequency response isn’t great. I measured the -3dB points at about 42Hz and 19.6kHz (44.1kHz sampling rate).
The Behringer UCA202
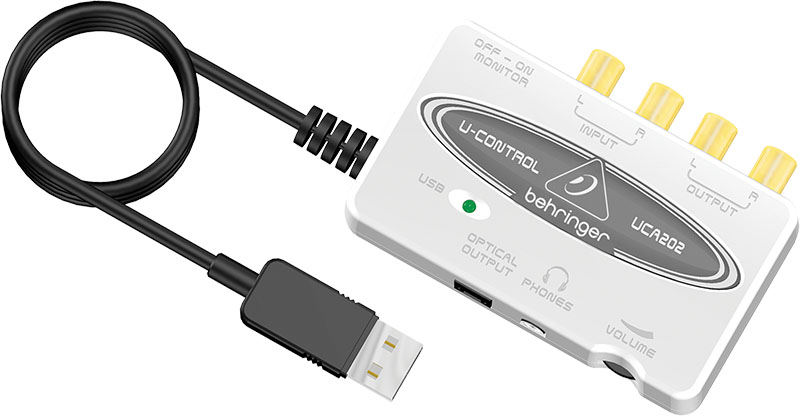
This5 was the cheapest well-regarded USB interface on Amazon, costing about £23.
The bandwidth was better than the generic CM6206 units: the -3dB points were at about 4Hz and 23.6kHz (48kHz sampling rate).
There is one oddity with the card: it inverts the audio signal, You can either deal with this in software, or rotate the image by 180° afterwards.
Software
Although there may be good solutions on Windows or Linux, I couldn’t find a good way to do this on OS X:
- iSpectrum6 does not have an XY-mode.
- SignalScope Pro7 will do the job but costs $150!
However, if we are looking at static displays, we can sidestep the problem, by dividing it into two parts:
- Begin by recording a short section of the signal—any program which can record audio will do this.
- Secondly, plot the data in the WAV file. I wrote a program to do this: you might know of better ways.
Saving the data to a WAV file
There are a couple of good, free, programs for grabbing the data. If you like graphical applications, then Audacity8 fits the bill. It runs on OS X, Windows and Linux, and it’s easy to select the USB sound interface, capture the data, then export them as a WAV file.
Alternatively if you prefer command-line tools, you’ll like SoX.9 Again it’s cross-platform, and on OS X you can install it with homebrew:
$ brew install soxThe only problem with SoX is that I couldn’t get it to select the correct input device. However, you can do that with the ‘Sound’ control in System Preferences. Once installed these runes will save 5 seconds of data to foo.wav:
$ sox -d -e signed-integer -b 16 foo.wav trim 0 5If you’re using the Behringer card, SoX can even invert the signals for you on the fly:
$ sox -d -e signed-integer -b 16 foo.wav trim 0 5 remix 1i 2iPlotting the WAV file data
I wrote some (bad) python to do this, which you can see on GitHub10 or just download.11
I was lazy and so my code assumes that you’ll give it a 16-bit signed PCM WAV file. It crashes unceremoniously if you use other formats.
All the clever bits came from others:
- Plotting Eye Diagrams from the SciPy cookbook;12
- the inevitable helpful article on Stackoverflow.13
You will need to have the numpy, scipy and matplotlib packages installed.
If you do have the right libraries and data to hand, it’s easy to use:
$ python xy-plot-wav.py foo.wav bar.wav ...Results
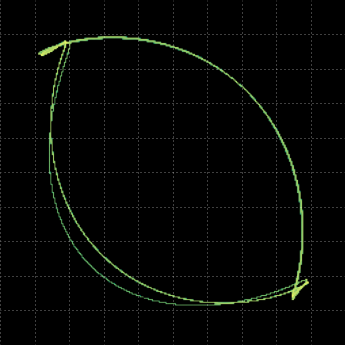
I essentially repeated the experiments I tried with XY plotting on scopes.14
In all of the plots below, you can see the results for both the Behringer (on the left) and the CM6202 (on the right) interfaces. The frame-rate increases down the page: the somewhat odd numbers simply reflect choosing round-numbers for delay constants and speeds in the code generating the signals.
Alert readers might notice that sometimes the Behringer signals appear to be larger despite this unit having lower sensitivity. The explanation is simple: to prevent clipping the inputs were sometimes scaled.
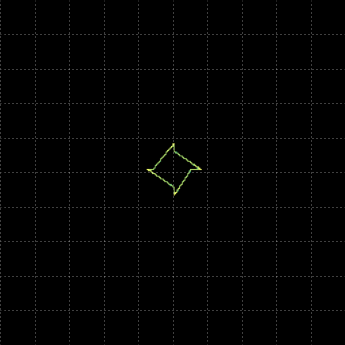
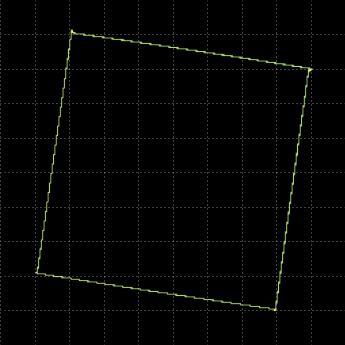
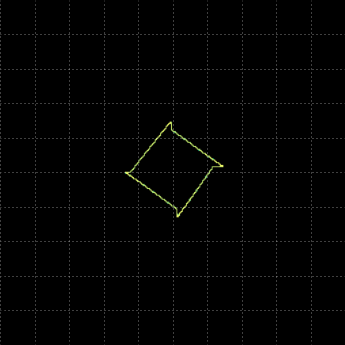
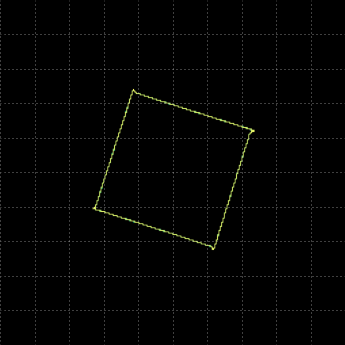
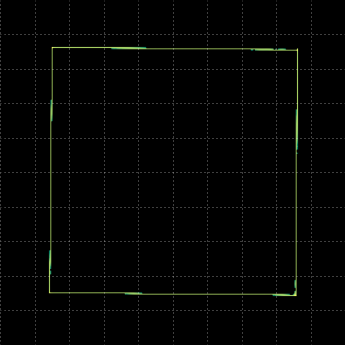
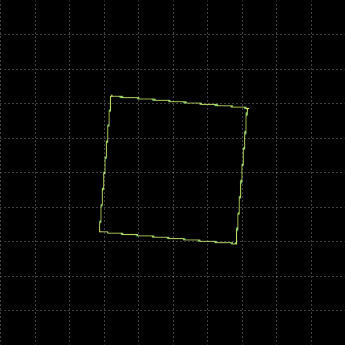
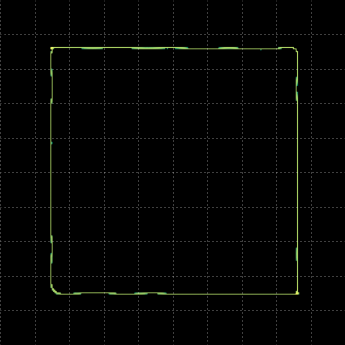
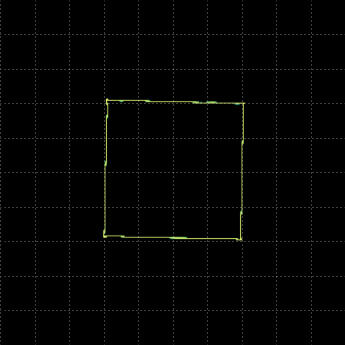
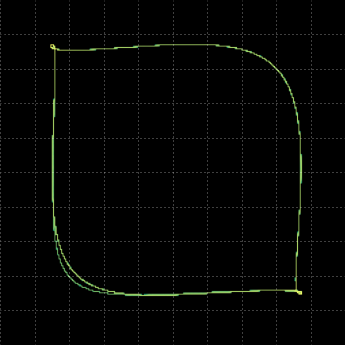
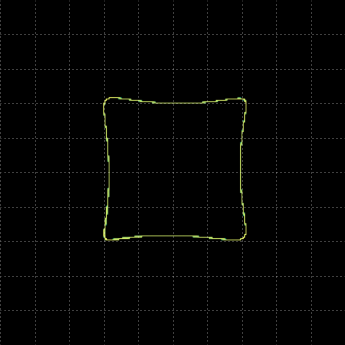
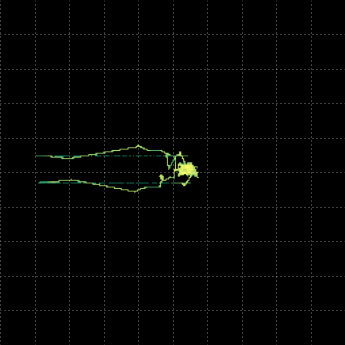
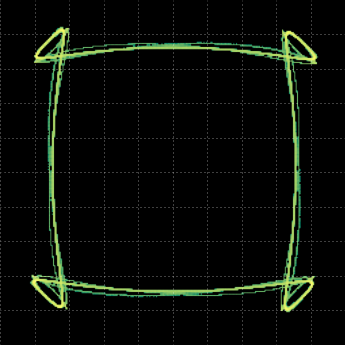
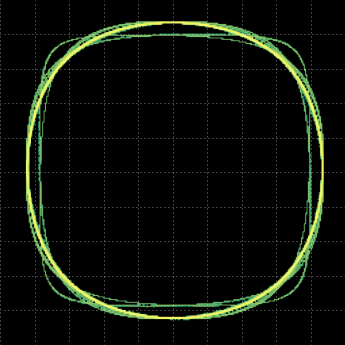
Drawing a square
I began by drawing squares. The Behringer was sampling at 48kHz, the CM6206 at 44.1kHz.
We can characterize three regimes:
- At low frequencies the shape is rotated, and, in the case of the CM6202 reduced in size. Physically, the rotation is a consequence of the phase shift in the interfaces’ low-frequency filter, and the shrinking its attenuation. The relatively poor low-frequency performance of the CM6202-based interface is clear.
- There is a surprisingly narrow regime at intermediate frequencies where the square is drawn faithfully.
- At high frequencies the shape degrades. On the CM6202, the degredation is broadly consistent with the intuitions gained from the scope experiments, but something strange happens on the Behringer.
My hardware for generating the signals was not able to go any faster, which was a bit of a shame. It would be nice to know if the Behringer plot gets yet crazier at higher frequencies!
11Hz frame rate

22Hz frame rate
90Hz frame rate

350Hz frame rate
1.3kHz frame rate
2.5kHz frame rate

4.5kHz frame rate
7.2kHz frame rate

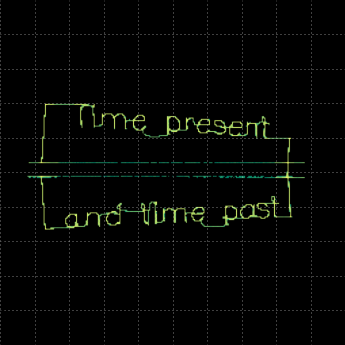
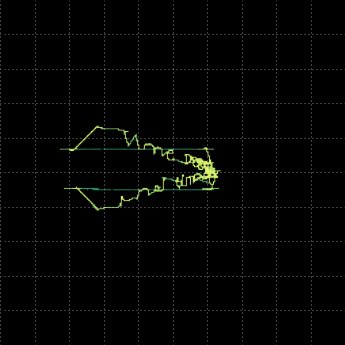
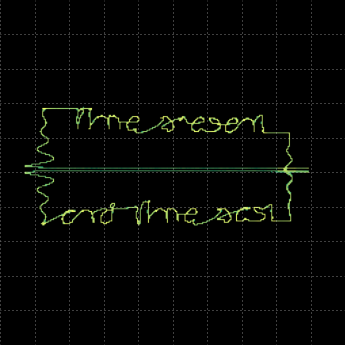
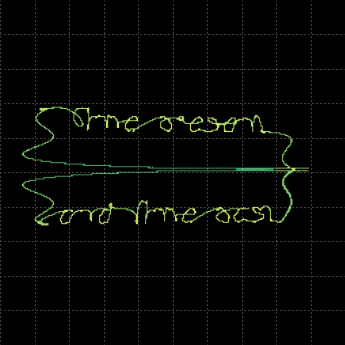
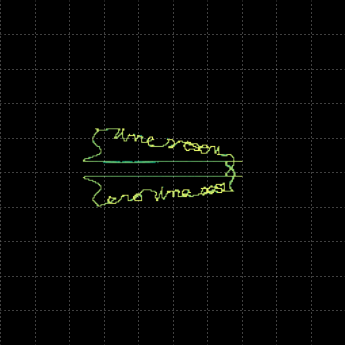
Drawing text
When drawing text, we can easily identify three temporal scales:
- The roughly piecewise constant signal in the y-direction that corresponds to the line of text.
- The slow sawtooth signal in the x-direction which corresponds to moving our pen along the line.
- The high frequency squiggles corresponding to each letter and the gaps between them.
The challenge in rendering text is to make the lowest frequencies high enough to defeat the low-frequency filters, whilst not pushing too many of the highest frequencies beyond the sound interface’s reach.
In broad terms, the Behringer manges this, but the CM6206 fails. Even with the Behringer though, the frame rate needs to be chosen carefully to get good results: the ratio of the fastest to slowest acceptable frame rate is only about three.
Even in the acceptable range, there is a clear compromise: if the frequency scale is low enough to preserve the high-frequency structure in the letters, the y-component decays noticably along the line and both lines of text slope towards the origin.
Note: The Behringer was sampling at 48kHz, the CM6206 at 44.1kHz.
11Hz frame rate

39Hz frame rate
70Hz frame rate


161Hz frame rate

206Hz frame rate
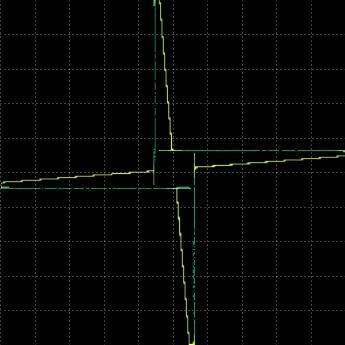
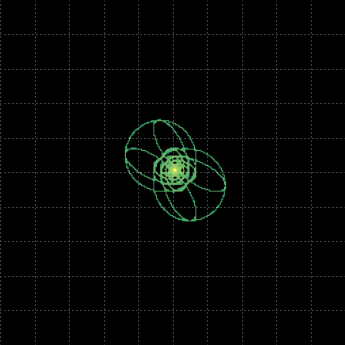
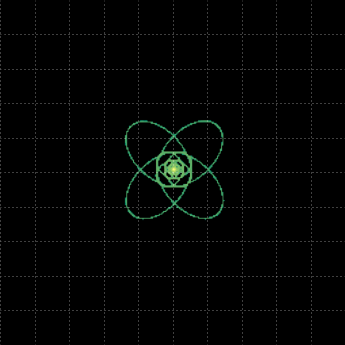
Drawing Dots
In this final experiment we feed quadrature square waves into the sound interface. Both interfaces were sampling at 44.1kHz.
The low frequency plots look strange at first, but are relatively easy to understand. The ‘true’ vertices of the square lie not on the corners of the square seen on the pictures, but rather further out on the far ends of the yellow diagonal traces.
Imagine that one of the square waves has just changed state, and we are sitting on one of those dots. If the wave’s frequency is sufficiently low the signal will begin to decay towards zero along the yellow trace. When then next transition occurs we’ll dash along the thin green line to the next vertex. Add a dash of overshoot and ringing for the usual high-frequency issues, and we have explained the plots.
This regime persists until about 2kHz, though the Behringer only shows the problem significantly up to about 50Hz. Once we hit 2kHz, the square degrades in much manner predicted by the theory (for more details see the scope article:15

Note that this happens at about the same frequency for both cards because the underlying issue is that harmonics of the square waves are being pushed above the cards’ upper frequency limit, which is roughly 20kHz for both cards.
On the CM6206 this process continues until only the fundamental frequency is passed by the card’s filtering, and we see a circle.
On the Behringer though, things are rather different. The 8kHz plot shows significant anti-correlation of the x- and y-axes. Indeed, at 10.5kHz, a reasonable model is \(x + y = 0\)! This doesn’t persist though: the 15.8kHz plot looks much like its 7.8kHz cousin. Presumably the sophisticated anti-aliasing filters on the interface have rather sophisticated and complicated failure modes too. It is tempting to explore this more, but that’s a job for another day.
Finally above 20kHz both cards, as expected, reject the incoming signals. We do see something, but it is hard to explain. Again a task for another day!
24Hz frame rate

50Hz frame rate


190Hz frame rate


390Hz frame rate


1950Hz frame rate


2600Hz frame rate


3900Hz frame rate

7800Hz frame rate

10.5kHz frame rate


15.8kHz frame rate


25.4kHz frame rate
A mobile solution
Although OS X lacks a good XY-scope program, on iOS we can use aptly named Oscilloscope app.16 Although not free, it is only £4.
We will still need a USB sound interface though which you can connect to the iPhone/iPad with a Lightning to USB camera adapter.17 Sadly this costs £25!
Of the USB sound interfaces I tried, only the Behringer18 worked: the others drew too much current.
Most of the plots are effectively identical to those generated above, so I include just one: text at the 70Hz frame rate, sampled at 44.1kHz:

Conclusions
It seems clear that you can use a sound card to plot a couple of signals in XY mode. However, I found it harder to get good results than I had anticipated, and wouldn’t really recommed it.
Condensing the whole thing into three lessons:
- The DC/low-frequency performance of the CM6206 interface is poor.
- The high-frequency performance of the Behringer is complicated.
- If you are drawing text in the obvious way, the audio spectrum is surprisingly cramped.
References
- 1. https://www.google.co.uk/search?q=sound+card+oscilloscope
- 2. http://www.instructables.com/id/Use-Your-Laptop-as-Oscilloscope/#step0
- 3. ./sound-card-data.html
- 4. http://www.cmedia.com.tw/ProductsDetail/page-p/C1Serno-25/C2Serno-26/C3Serno-0/PSerno-23.html
- 5. http://www.behringer.com/EN/Products/UCA202.aspx
- 6. http://dogparksoftware.com/iSpectrum.html
- 7. http://www.faberacoustical.com/products/signalscope_pro/
- 8. https://en.wikipedia.org/wiki/Audacity_%28audio_editor%29
- 9. https://en.wikipedia.org/wiki/SoX
- 10. https://github.com/mjoldfield/xy-plot-wav
- 11. https://raw.githubusercontent.com/mjoldfield/xy-plot-wav/master/xy-plot-wav.py
- 12. http://wiki.scipy.org/Cookbook/EyeDiagram
- 13. http://stackoverflow.com/questions/23154400/read-the-data-of-a-single-channel-from-a-stereo-wave-file-in-python
- 14. ./xy-scope.html
- 15. ./xy-scope.html
- 16. https://itunes.apple.com/gb/app/oscilloscope/id388636804?mt=8
- 17. http://www.apple.com/uk/shop/product/MD821ZM/A/lightning-to-usb-camera-adapter
- 18. http://www.behringer.com/EN/Products/UCA202.aspx
![[ Atom Feed ]](../../atom.png "Atom Feed")